What changes for Santa Clara residents: the county is getting older and has far fewer children than five years ago, according to the latest U.S. Census Bureau Vintage 2025 estimates. Local school enrollment, public services and long‑range planning face consequences from those shifts.
Population trends and what the numbers show
The Census Bureau’s estimates, covering July 1, 2020 through July 1, 2025, indicate the county has not fully recovered from pandemic‑era losses and remained about 0.9% below its 2020 population as of July 2025. During 2022–2025 the county did add residents year over year, including an increase of 6,481 people from July 2024 to July 2025. That gain was largely offset by domestic outmigration, which produced a net loss of 19,775 residents over the period.
A major demographic shift is the narrowing gap between children and older adults. In July 2020, children under 18 outnumbered residents 65 and older by 140,577. By July 2025 that gap had fallen to 48,468. Children now constitute 18.8% of the county population; those 65 and older make up 16.3%. The county’s median age rose to 38.4 from 37.5 in 2020.
"Santa Clara County is growing older—and losing children faster—than nearly anywhere else in California."
School‑age population and racial/ethnic shifts
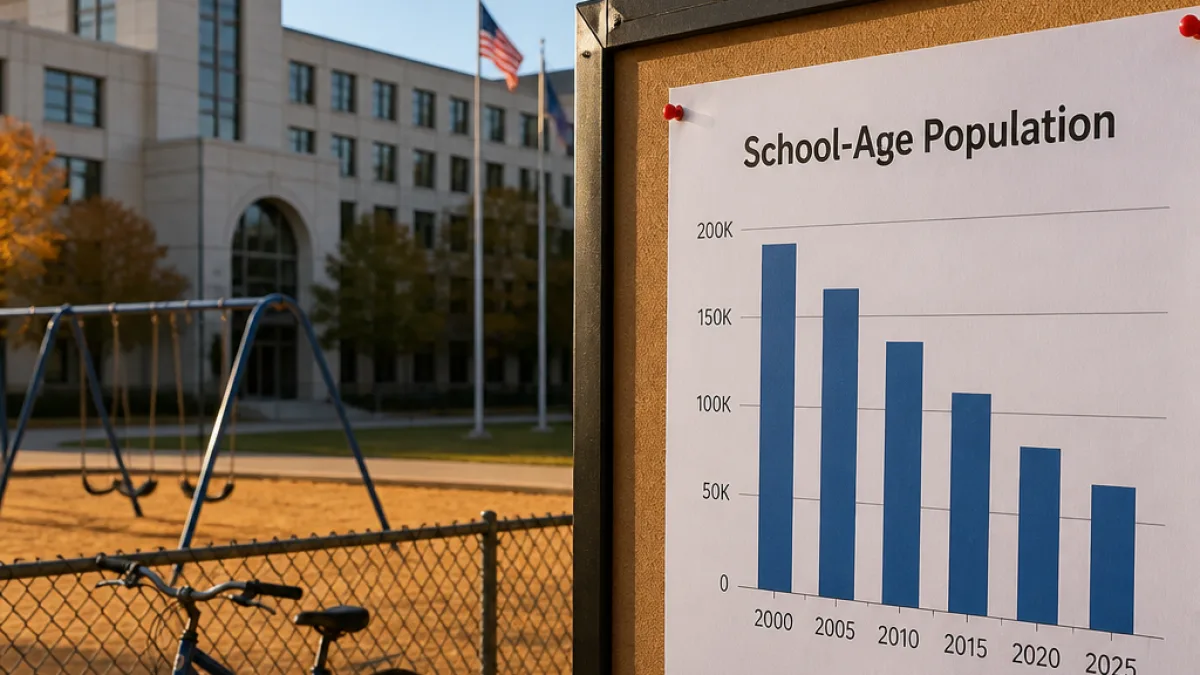
The school‑age population (ages 5–17) fell from 302,150 in 2020 to 266,586 in 2025, a decline of 35,564, or 11.8%. That decrease placed the county among those with the largest drops in school‑age residents statewide.
The county’s racial and ethnic composition continued to change. The non‑Hispanic Asian alone population grew by 67,941 (about 9.0%), while the non‑Hispanic White alone population decreased by 76,203 (about 13.5%), according to the Census estimates.
- Net population change 2020–2025: roughly -0.9% compared with 2020.
- School‑age population (5–17): -35,564 (11.8%).
- Median age: 38.4 in 2025, up from 37.5 in 2020.
Local implications
For Santa Clara residents, these trends can affect a range of local priorities: school enrollment numbers and district funding; demand for early childhood services and pediatric care; planning for senior services, housing and transportation; and workforce composition. City and county planners, school officials and health providers will need to account for an older median age and a shrinking cohort of children when forecasting future needs.
| Measure | 2020 | 2025 | Change |
|---|---|---|---|
| Children (under 18) vs. 65+ | Children ahead by 140,577 | Children ahead by 48,468 | Gap narrowed by 92,109 |
| School‑age (5–17) | 302,150 | 266,586 | -35,564 (-11.8%) |
| Median age | 37.5 | 38.4 | +0.9 years |
Officials and agencies will want to review the U.S. Census Bureau Vintage 2025 release for full details. The estimates provide the most recent snapshot of demographic change on which local leaders can base policy, budget and service decisions.